GPU Usage
Each lince server has 2 NVIDIA Tesla GPUs installed. This cluster should be used to run GPU jobs; if you don’t need GPU then use aguia instead.
You may check the GPU usage with the nvidia-smi command in any server except the login server which is used only for job scheduling.
Example of GPU using 67MiB of memory usage, 74% and 0% utilization on GPU 0 and 1 respectively and process ID 29150:
$ nvidia-smi
Sun May  2 16:54:50 2021
+-----------------------------------------------------------------------------+
| NVIDIA-SMI 418.67       Driver Version: 418.67       CUDA Version: 10.1     |
|-------------------------------+----------------------+----------------------+
| GPU  Name        Persistence-M| Bus-Id        Disp.A | Volatile Uncorr. ECC |
| Fan  Temp  Perf  Pwr:Usage/Cap|         Memory-Usage | GPU-Util  Compute M. |
|===============================+======================+======================|
|   0  Tesla K20m          Off  | 00000000:05:00.0 Off |                    0 |
| N/A   68C    P0   106W / 225W |     78MiB /  4743MiB |     74%      Default |
+-------------------------------+----------------------+----------------------+
|   1  Tesla K20m          Off  | 00000000:83:00.0 Off |                    0 |
| N/A   30C    P8    16W / 225W |      0MiB /  4743MiB |      0%      Default |
+-------------------------------+----------------------+----------------------+

+-----------------------------------------------------------------------------+
| Processes:                                                       GPU Memory |
|  GPU       PID   Type   Process name                             Usage      |
|=============================================================================|
|    0     29150      C   ...gramas/intel/gromacs-5.1.4-cuda/bin/gmx    67MiB |
+-----------------------------------------------------------------------------+
Message “No running processes found” on idle GPUs:
$ nvidia-smi
Sun May  2 16:55:18 2021
+-----------------------------------------------------------------------------+
| NVIDIA-SMI 418.67       Driver Version: 418.67       CUDA Version: 10.1     |
|-------------------------------+----------------------+----------------------+
| GPU  Name        Persistence-M| Bus-Id        Disp.A | Volatile Uncorr. ECC |
| Fan  Temp  Perf  Pwr:Usage/Cap|         Memory-Usage | GPU-Util  Compute M. |
|===============================+======================+======================|
|   0  Tesla K20m          Off  | 00000000:05:00.0 Off |                    0 |
| N/A   36C    P8    25W / 225W |     11MiB /  4743MiB |      0%      Default |
+-------------------------------+----------------------+----------------------+
|   1  Tesla K20m          Off  | 00000000:83:00.0 Off |                    0 |
| N/A   28C    P8    16W / 225W |      0MiB /  4743MiB |      0%      Default |
+-------------------------------+----------------------+----------------------+

+-----------------------------------------------------------------------------+
| Processes:                                                       GPU Memory |
|  GPU       PID   Type   Process name                             Usage      |
|=============================================================================|
|  No running processes found                                                 |
+-----------------------------------------------------------------------------+
$
Example of error message:
$ nvidia-smi
Unable to determine the device handle for GPU 0000:05:00.0: GPU is lost.  Reboot the system to recover this GPU
Check all servers
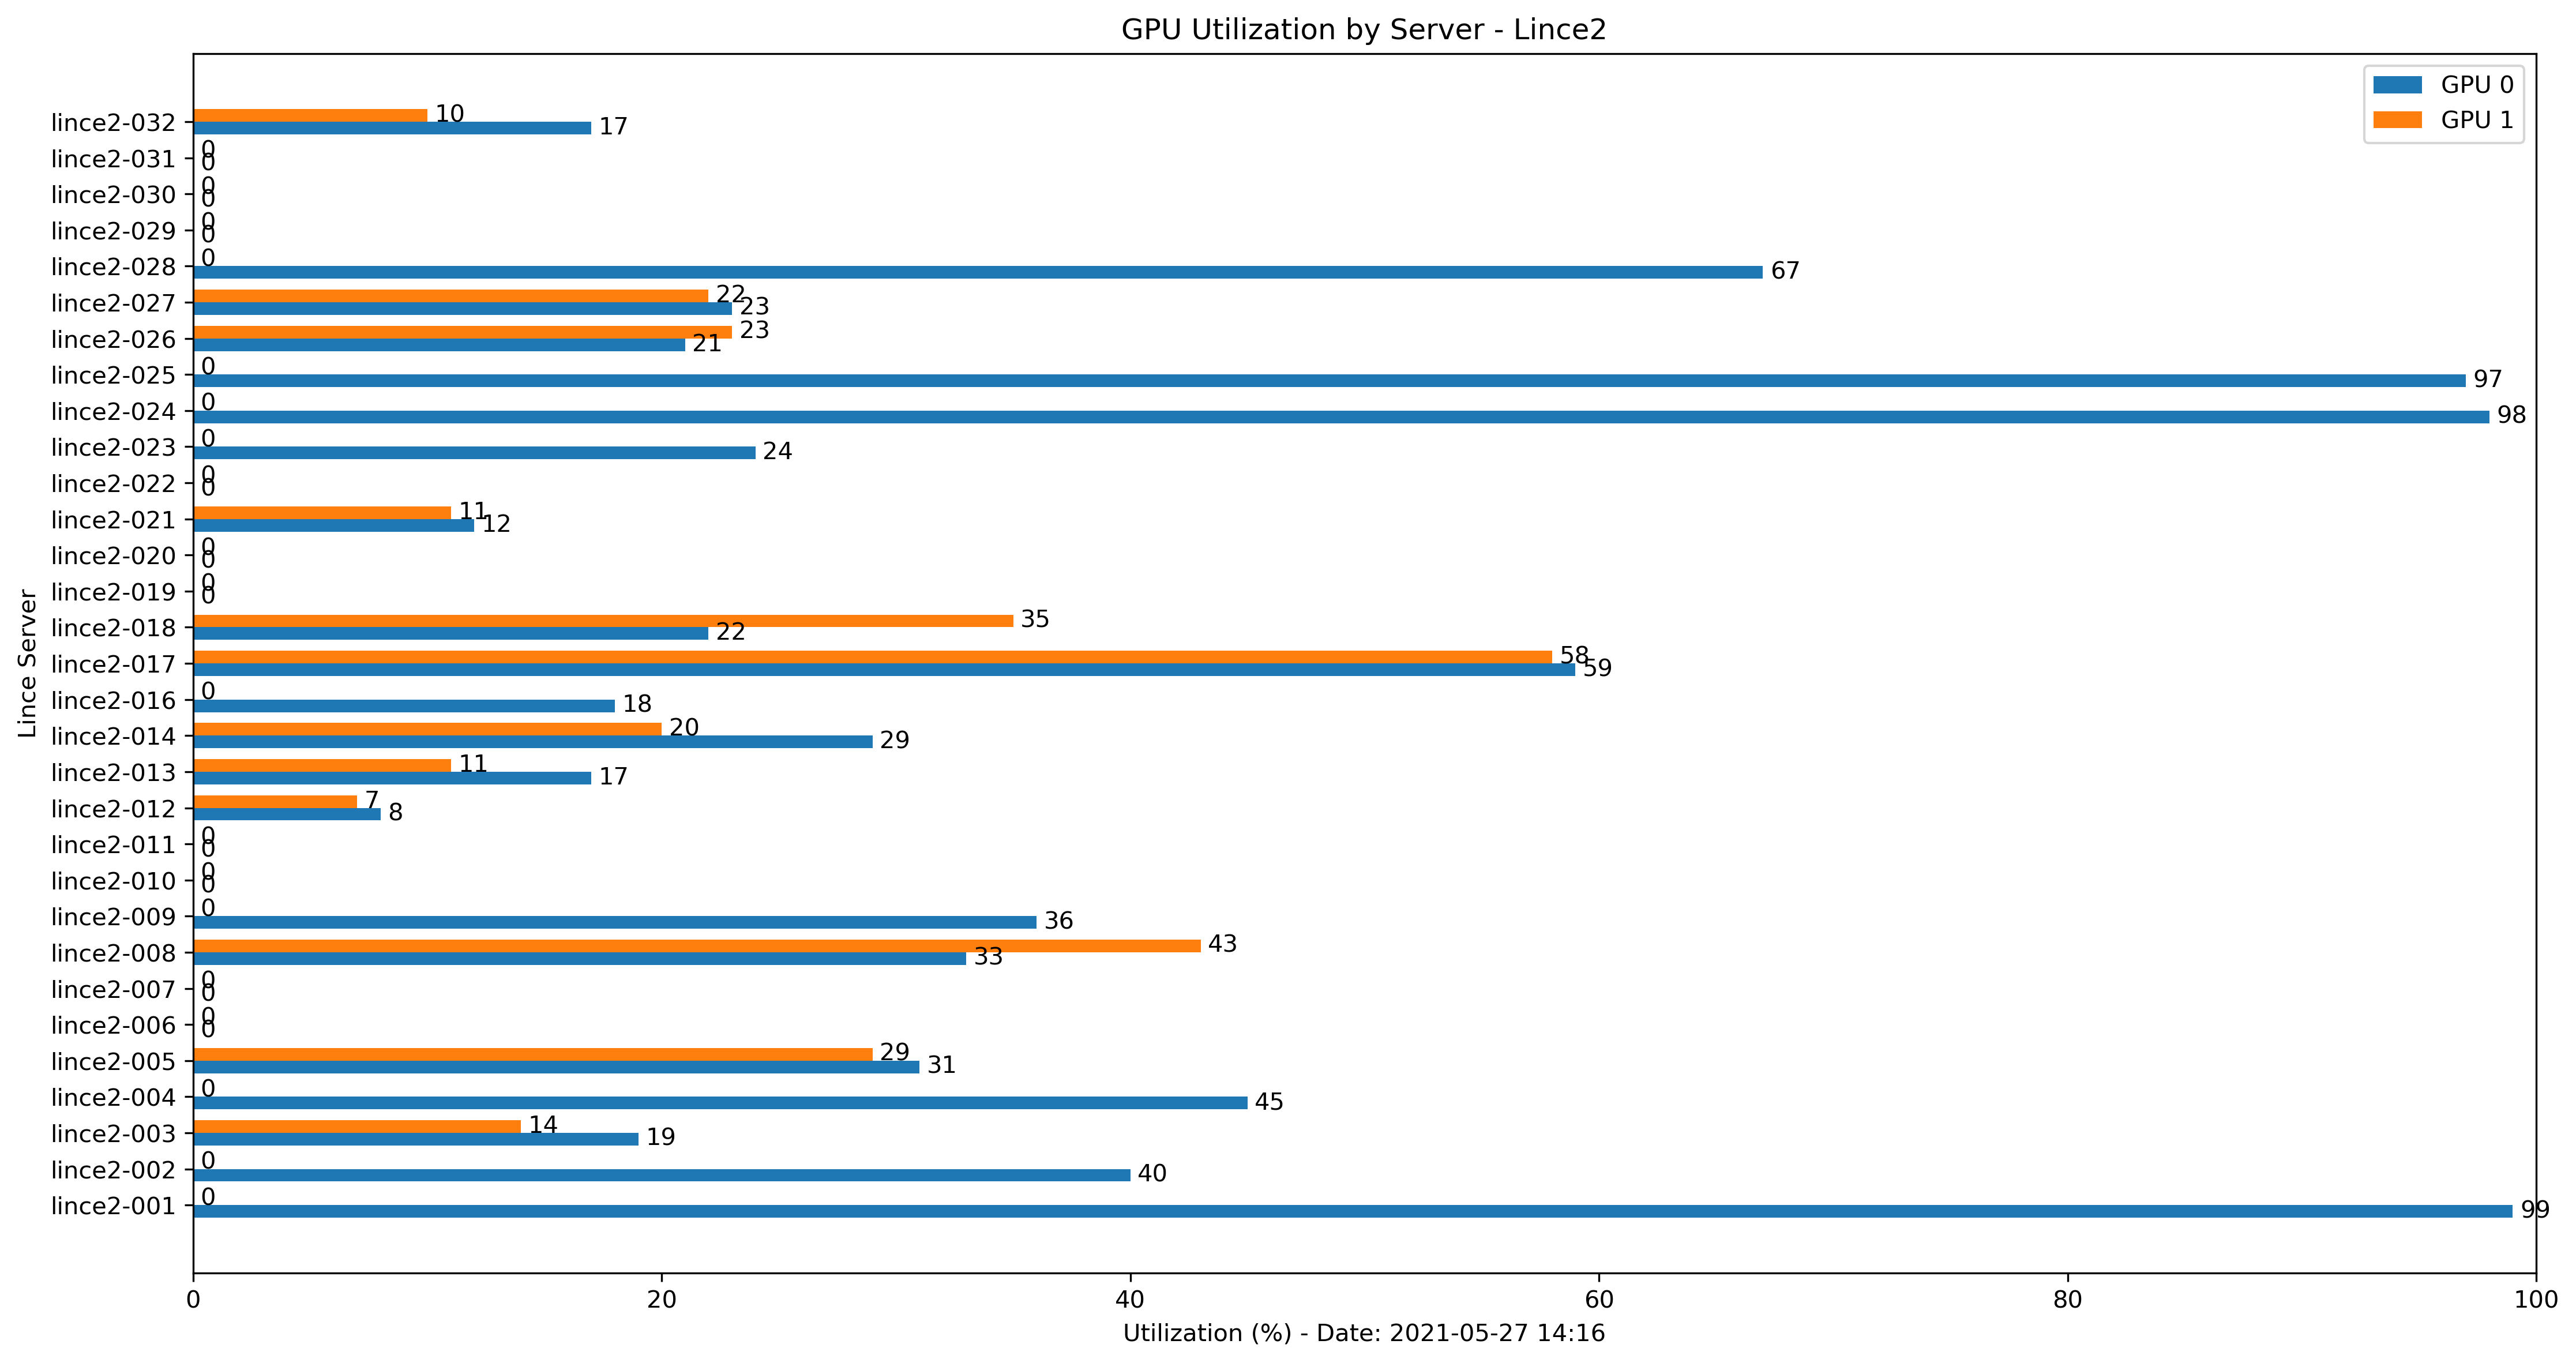
A more practical way to check the GPU usage in all servers is using a script. The gpu_mon.py script connects to each server and checks the GPU status. Then, it prints a list of servers with idle and falty GPUs, creates a bar plot and sends an e-mail with GPU usage:
$ python gpu_mon.py
Number of servers: 32

Two GPUs in use: 13 servers.
------------------------------
lince2-003
lince2-005
lince2-008
lince2-012
lince2-013
lince2-014
lince2-017
lince2-018
lince2-020
lince2-021
lince2-026
lince2-027
lince2-032

One GPUs in use: 10 servers.
------------------------------
lince2-001
lince2-002
lince2-004
lince2-009
lince2-011
lince2-016
lince2-023
lince2-024
lince2-025
lince2-028

No GPUs in use: 8 servers.
------------------------------
lince2-006
lince2-007
lince2-010
lince2-019
lince2-022
lince2-029
lince2-030
lince2-031

Faulty GPUs: 0 servers.
------------------------------

Connection failure: 1 servers.
------------------------------
lince2-015
gpu_mon script:
#!/scratch/11568881/miniconda3/bin/python
#%%
"""
This module collects GPU utilization on all servers in lince cluster. This is useful to help
identify possible improvements in job speed and free resources for other users.
Ideally GPU utilizatin should be high for the most part of the time.

Process:
1. Connect to all servers via SSH and collect GPU usage.
2. Create a data frame with server and both GPUs usage.
3. Create a horizontal bar chart of GPU usage by server.
4. Send a summary and plot by e-mail.
"""
import os, re, datetime
import numpy as np
import pandas as pd
import matplotlib.pyplot as plt
import smtplib, mimetypes
from email.message import EmailMessage

def message(msg, servers):
        """Format server status message."""
        text = '\n'
        text += msg + str(len(servers)) + " servers.\n"
        text += "-"*30 + "\n"
        for server in servers:
                text += server + '\n'
        return text

def gpustatus(result_fname, summary_fname):
        """Connect to each server and collect GPU information.
Result is saved in a log file.
"""
        gpu = {}        # GPU utilization
        no_gpu = []     # Servers with 0 GPUs in use
        one_gpu = []    # Servers with 1 GPU in use
        two_gpu = []    # Servers with 2 GPUs in use
        gpudown = []    # Servers with faulty GPUs
        no_route = []   # Servers with connection failure
        servers = []    # List of servers
        df = pd.DataFrame(columns = ['Server', 'GPU 0', 'GPU 1'])

        for n in range(1, 33):
                # Connect to each server in the cluster and send commands
                server_name = 'lince2-' + ("000" + str(n))[-3:]
                servers.append(server_name)
                cmd = 'ssh {} "hostname;nvidia-smi"'.format(server_name)
                pipe = os.popen(cmd,'r')

                print("Processing server:", server_name)
                for row in pipe.read().split('\n'):
                        #lince2-001.hpc.usp.br
                        server_re = re.search(r'(lince\d-(\d+))\.hpc', row)
                        #|   0  Tesla K20m          Off  | 00000000:05:00.0 Off |                    0 |
                        gpuId_re = re.search(r'\|\s+(\d)\s+Tesla', row)
                        #| N/A   62C    P0   104W / 225W |     78MiB /  4743MiB |     73%      Default |
                        utilization_re = re.search(r'B \|\s+(\d+)%\s+', row)

                        # Read server name
                        if server_re:
                                server = server_re.group(1)
                        # Read GPU error message
                        elif "Unable to determine the device handle for GPU" in row:
                                gpudown.append(server)
                        # Read GPU ID: 0 or 1
                        elif gpuId_re:
                                gpuId = int(gpuId_re.group(1))      # GPU 0 or 1
                        # Read GPU utilization
                        elif utilization_re:
                                gpu[gpuId] = int(utilization_re.group(1))
                                if gpuId:
                                        df.loc[len(df) + 1] = server, gpu[0], gpu[1]
                                        # Identify number of GPUs in use
                                        if not (gpu[0] or gpu[1]):
                                                no_gpu.append(server)   # 0 GPUs in use
                                        elif gpu[0] and gpu[1]:
                                                two_gpu.append(server)  # 1 GPU in use
                                        else:
                                                one_gpu.append(server)  # 2 GPUs in use

                pipe.close()

        # Connection failure
        checked_servers = two_gpu +  one_gpu +  no_gpu +  gpudown
        for server in servers:
                if not server in checked_servers:
                        no_route.append(server)
        checked_servers += no_route
        # Summary of GPU usage
        n =  len(checked_servers)
        summary = "Number of servers: {} \n".format(str(n))
        summary += message("Two GPUs in use: ", two_gpu)
        summary += message("One GPUs in use: ", one_gpu)
        summary += message("No GPUs in use: ", no_gpu)
        summary += message("Faulty GPUs: ", gpudown)
        summary += message("Connection failure: ", no_route)

        print(summary)
        # Save data frame and summary
        df.to_csv(result_fname)
        with open(summary_fname, 'w') as f:
                f.write(summary)

        return

def create_plot(result, plot):
        """Create plot of GPU usage per server."""
        df = pd.read_csv(result)
        # Create plot
        x = np.arange(len(df['Server']))  # the label locations
        width = 0.35  # the width of the bars

        fig, ax = plt.subplots(figsize=(15,8))
        rects1 = ax.barh(x - width/2, df['GPU 0'], width, label='GPU 0')
        rects2 = ax.barh(x + width/2, df['GPU 1'], width, label='GPU 1')

        # Add some text for labels, title and custom x-axis tick labels, etc.
        now = datetime.datetime.now()
        dt = now.strftime("%Y-%m-%d %H:%M")

        ax.set_title('GPU Utilization by Server - Lince2')
        ax.set_xlabel('Utilization (%) - Date: {}'.format(dt))
        ax.set_xlim(0, 100)
        ax.set_ylabel('Lince Server')
        ax.set_yticks(x)
        ax.set_yticklabels(df['Server'])
        ax.legend()

        ax.bar_label(rects1, padding=3)
        ax.bar_label(rects2, padding=3)

        fig.tight_layout()

        # Save and show plot
        plt.savefig(plot, dpi=300, bbox_inches='tight')
        plt.show()

        return

def send_email(receiver, message, plot_fname):
   """Send email with summary of GPU usage and plot."""
   # Create message and set text content
   sender = 'no-reply@lince2.hpc.usp.br'
   msg = EmailMessage()
   msg['Subject'] = 'Lince: GPUs Status'
   msg['From'] = sender
   msg['To'] = receiver

   # Message content
   body = """*** Automatic e-mail, do not reply. ***

Status of lince servers.

See attached plot.

"""
   body += message
   msg.set_content(body)

   # Attach plot
   with open(plot_fname, 'rb') as fp:
          file_data = fp.read()
          maintype, _, subtype = (mimetypes.guess_type(plot_fname)[0] or 'application/octet-stream').partition("/")
          msg.add_attachment(file_data, maintype=maintype, subtype=subtype, filename=plot_fname)

   # Send e-mail
   with smtplib.SMTP('localhost') as server:
          server.sendmail(sender, receiver, msg.as_string())
          print("Successfully sent email")


if __name__ == '__main__':
        now = datetime.datetime.now()
        dt = now.strftime("%Y%m%d_%H%M")
        plot_fname = 'plot/gpu_status_{}.png'.format(dt)
        result_fname = 'gpu.csv'
        summary_fname = 'summary.txt'

        # 1. Execute GPU checks
        gpustatus(result_fname, summary_fname)

        # 2. Create plot
        create_plot(result_fname, plot_fname)

        # 3. Send result by e-mail
        receiver = 'your@email.com'
        with open(summary_fname, 'r') as f:
                rows = f.readlines()
                msg = ''
                for row in rows:
                        msg += row
        send_email(receiver, msg, plot_fname)

        # 4. Delete files
        for fname in [plot_fname, result_fname, summary_fname]:
                os.unlink(fname)